
What Does Surface Roughness Comparison Reveal About Machining Precision
What Does Surface Roughness Indicate About Machining Precision?
Surface roughness comparison serves as one key sign of machining precision. It shows more than just how even a surface feels. It reveals how steady and managed the whole process is. In careful manufacturing work, tiny changes in the feel of the surface can point to tool wear or shakes that mess with exact sizes.
Relationship Between Surface Texture and Dimensional Accuracy
Surface texture mirrors how well the machine tool path, feed rate, and shakes are kept in check during cutting. A smooth surface finish often matches close size limits. This happens because the forces from cutting stay even and easy to predict. If roughness numbers shift from what you expect, it usually means the tool edge has gotten dull. Or, shakes have started in the setup. Take a turned shaft as an example. If its Ra values change up and down along the length, that could mean the spindle is off balance. Or, heat shifts happened during the work.
Influence of Machining Parameters on Roughness Quality
Cutting speed, feed rate, and depth of cut all shape the quality of the surface finish. A faster cutting speed can cut down on edge build-up. But it might also create more heat. Feed rate sets how far apart the tool marks sit. If it’s too fast, you’ll see bumps. If it’s too slow, you lose time without better smoothness. Depth of cut changes the load on the chip and how much it shakes. Workers often tweak these settings bit by bit. They aim to mix speed with even texture. Bad mixes lead to shake marks or uneven shapes. No after-work polishing can fix those fully.
Correlation Between Roughness Values and Functional Performance
Smaller Ra numbers boost strength against tiredness by cutting down spots where stress builds up. In jobs that need seals, smoother surfaces make better contact. They lower the chance of leaks. But not all parts gain from super smooth finishes. Some parts that slide need tiny grooves to hold oil. Too much roughness raises rubbing and speeds up wear. This leads to early breakdowns in bearings or pistons. Those parts move back and forth under steady loads.
How Do Different Machining Processes Compare in Surface Roughness?
Each way of machining makes its own type of surface pattern. This depends on how the material gets cut or bent. Looking at these patterns helps workers pick the best method. They match it to how the part works and how much it costs.
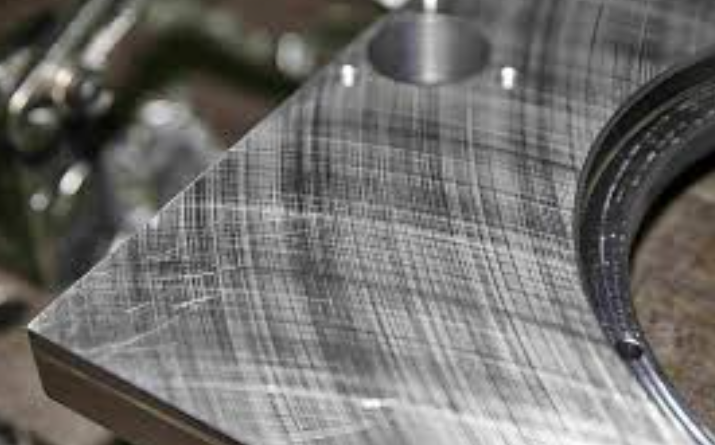
Turning and Milling Surface Characteristics
Turning makes straight tool marks that follow the feed path. This gives a regular pattern that’s great for round parts like shafts or sleeves. Milling makes lines that cross each other. These come from the cutter shape and how much it steps over. Both ways can get good smooth finishes. Think Ra near 0.8 µm. You need sharp tools, good coolant, and a strong machine to do that.
Grinding and Honing Precision Levels
Grinding gives very fine smoothness for tight fits. It’s good for things like bearing tracks or mold insides. Honing goes even further. It makes crossed line patterns that help hold oil in cylinders or engine walls. These final steps not only make the surface look better. They also fix shape mistakes from rough cutting before.
EDM, Laser, and Additive Manufacturing Surface Profiles
Electrical discharge machining (EDM) leaves a thin melted layer from the heat. This layer changes the tiny structure and evenness of the surface. You often need extra polishing to remove it. Laser work creates special textures from quick melt and cool cycles. These change with how much energy the pulse has. Additive manufacturing needs after-work like grinding or chemical smoothing. It aims for similar Ra numbers. Layer by layer building naturally adds step-like edges.
Why Is Surface Roughness Comparison Important for Quality Control?
In places where making the same thing over and over counts most, checking surface roughness data gives clues about how steady the process is. It also shows if the gear is healthy. I recall a shop once where they ignored small roughness jumps. It led to a whole batch of bad parts. That’s why tracking matters.
Verification of Process Stability Through Measurement Data
Steady roughness numbers over many groups prove the cutting stays the same. Any quick change warns workers of tool wear or wrong setup. This happens before size mistakes show up. Looking at number trends from these checks helps plan fixes ahead. It stops big stops in work.
Alignment With Design Specifications and Tolerances
Each part has a plan based on what it does. The surface finish must fit that plan for good work. Size limits set okay ranges for Ra or Rz. Going over them hurts how parts fit together or seal. For turbine blades, you need very smooth finishes. They cut air drag. Gearbox cases can handle a bit more roughness. It won’t hurt how they run.
Optimization of Cost Versus Finish Requirements
Going after super fine finishes takes more time and tool money. It doesn’t always help the part work better. By checking what roughness you can get from different ways, like milling against grinding, you choose smart. A surface roughness comparison chart helps many shops. They match tech needs with money limits well.
What Are the Standard Metrics Used in Surface Roughness Comparison?
Surface checking uses set measures. This way, data from various machines or labs match up around the world.
Average Roughness (Ra) as a Universal Indicator
Ra means the simple average shift from a center line over a test length. It’s easy and used in many fields as a basic smoothness sign. But it skips lone high points or low spots. Those can affect how seals work or how coatings stick.
Maximum Height (Rz) for Evaluating Peak-to-Valley Variation
Rz checks average height gaps between top peaks and bottom valleys over a few test lengths. It shows better how parts touch under weight than Ra by itself. That’s because it catches big changes key for sliding spots like valves or seals.
Peak-to-Valley Distance (Rmax) for Detecting Extreme Defects
Rmax spots the biggest single bump in the test area. It’s handy when one scratch could ruin things. Think optical lenses or plane parts that need perfect finishes under push.
How Does Measurement Technique Affect Roughness Comparison Accuracy?
How true the measure is depends a lot on picking the right way and keeping tools tuned. It’s not just about cost.
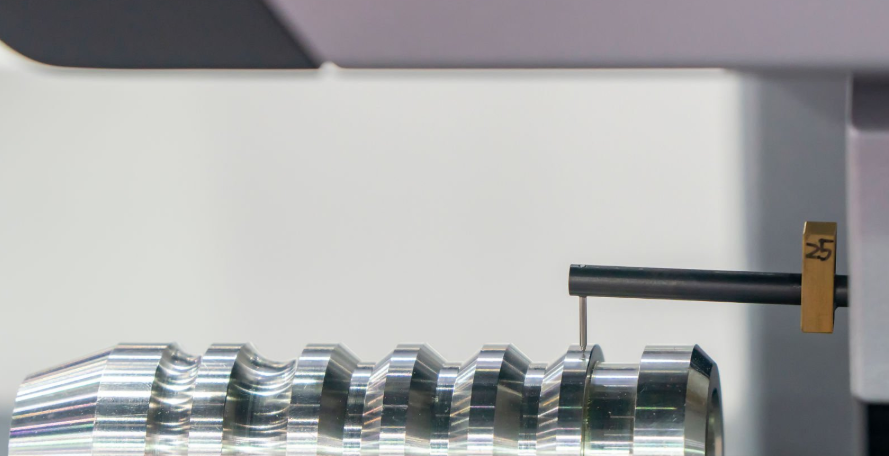
Contact Profilometry Versus Optical Methods
Touch profilometers give straight readings. But they can scratch soft surfaces if the tip presses too hard. Optical ways like interferometry skip touch. They grab full 3D pictures good for soft stuff like plastics or covered metals. Pick based on detail needs and how often you check. Not just old habits.
Influence of Sampling Length and Filtering Parameters
Short test lengths show tiny texture bits. But they can make noise seem bigger. Longer ones give middle profiles better for checking trends between groups. Filter settings must stay the same. That way, results match no matter the machine brand or who does it.
Calibration Standards and Traceability Requirements
Test pieces keep tools right over time. You check them now and then against ISO 4287/4288 rules. This link back ensures matches worldwide. It’s key when parts get made in one spot but put together far away under tough quality rules. In my experience, skipping cal checks once cost a team hours of re-measures.
How Can Engineers Use Surface Roughness Comparison to Improve Machining Processes?
Surface numbers do more than report. They give real tips to make the work better at each step. For instance, in a factory I know, they used roughness data to tweak speeds and saved 20% on waste.
Process Parameter Adjustment Based on Measured Data
When live checks show Ra going up, you can change feed rate or coolant to get back on track. This stops bad parts from piling up. New CNC setups have auto parts that shift settings from sensor news. They keep things even over long work times.
Tool Selection and Maintenance Strategies Driven by Roughness Trends
Tool shape, like rake angle or coating kind, affects how chips form. This shows in roughness changes over time. Watching those helps time tool swaps before dull parts make finishes too bad. It cuts down on fix work a lot.
Integration With Digital Manufacturing Systems for Predictive Quality Control
Tying surface info to digital models lets you test changes in sims. AI looks at old data to guess finishes for new batches. This fits big new factory goals. It means fixing ahead, not after trouble hits. It’s a move to smarter ways of making exact parts.
What Insights Does Surface Roughness Comparison Provide About Future Machining Precision?
As tech grows, it changes how we read surface feel data against exact standards. Exciting stuff ahead, though some old methods still hold up surprisingly well.
Advancements in High-Speed Machining Technologies
New spindles cut down shakes from speed. Better coolant helps clear chips fast at high turns. Mix additive and cut systems now blend building freedom with finish exactness. Things once impossible in one machine.
Role of Automation and Machine Learning in Predictive Finishing
Auto check tools close info loops quicker than hand work. Learning programs from past cut data guess finishes before you start. For each material group. This keeps evenness over thousands of items without much worker help. Imagine running a line with no surprises—that’s the goal.
Material Innovation Impact on Achievable Surface Quality
New metal mixes act different under cut forces. Some make smaller chips that cut tearing. Others need coated tools to stop sticking that ruins even finishes. Mix parts with fibers add issues. Fiber direction shapes tiny hills, so you need special end steps. Not just same old plans.
FAQ
Q1: What does surface roughness comparison reveal about machining consistency?
A: It highlights whether your process maintains stable conditions across runs by tracking changes in measured texture values over time.
Q2: Which parameter best represents overall smoothness?
A: Ra is most commonly used as it provides an average measure applicable across various machining methods though it misses isolated peaks.
Q3: Why might two parts with identical Ra values perform differently?
A: Because Ra alone doesn’t describe peak distribution; Rz or Rmax may differ affecting lubrication retention or stress concentration behavior.
Q4: How often should instruments be calibrated for accurate comparisons?
A: Regularly according to ISO 4287/4288 guidelines using certified reference specimens ensures traceable accuracy between facilities worldwide.
Q5: Can automation fully replace manual inspection for surface evaluation?
A: Not entirely yet—but automated optical systems combined with AI analytics already handle most routine comparisons faster with fewer human errors involved.